Stepping through code
Once the execution of an application has paused, you might want to take it slow and go through your code one line at a time. There are number of commands for exactly this purpose, but the two most important ones are step and next, they are very similar in functionality but the difference between them is important.
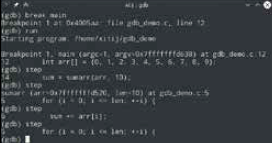
Let’s say we put a breakpoint on the main function using break main and then started the execution using the run command. At this point gdb will display the current line of code. In the case of our example program above it will be the line declaring the integer array. Now when we give gdb the step or next command it it’ll execute this line of code, and then display the next line of code to be executed.
Where step and next differ is in now they handle function calls in your code. If you have you main function call another function in your code (like we have our main function calling sumar) then the next will treat this like a single instruction and continue on to the next line after the function call. On the other hand, step will move the execution of the code inside the called function and let you execute that line by line as well.
Both of these commands can also take an optional numeric argument that specifies how many times the command is to be repeated. For instance, step 4 will step through four lines of code at a time. If you’re inside a function, and want to quickly get to the end of the function and see the return value, you can use the finish command. If you’d rather just return from the function without executing it, you can use the return command.
Any value you specify after return will be the value returned from the function call. While breakpoints halt the execution of code, you can use the continue command to resume executing the program till it reaches the next breakpoint (or the end of the program). If you want to continue executing the code till a particular line number use until <line_number>.
The step and next commands execute your program one line of code at a time, however each line of code does not always correspond to a single CPU instruction. If you want even more fine tuned execution you can use the stepi and nexti commands
that execute your code one assembly instruction at a time.
Inspecting program state
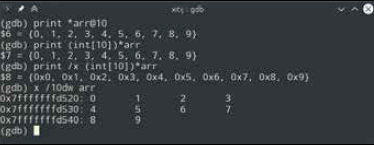
The final thing you need to know (at least for the purposes of this basic introduction) is how to actually peek into the running program and display the values of various variables. The most important command to inspect data is the print <variable> command. Any variable that is visible in the current scope of the program can be printed using this command. It tries to display the variable in a format appropriate for its type. So a char will display as a character, an int, short or long will display as an integer number, while float and double values will display as floating point numbers. It can also print character strings automatically, however for other types of arrays, you need to be a little more specific. For instance if you wish to display an array called arr of lenth 10, you can use the print command as one of the following:
print print (int[10])arr print (int[])arr
The third one above will try to automatically calculate the length. If you want you can override the display format by specifying the format with print as print /format where format is x for hex, d for signed decimal, o for octal, s for string. There are more format options available.
Neither step not next will enter external functions like printf
The large hex numbers that “x” prints in the left-most column are the memory addresses of the printed rows
Another command to display the value of variables is x for eXplore, which takes a memory location rather than a variable name. It can be quite useful for exploring pointers and arrays. If you provide it an address, or the name of a pointer, it can be used not only to display the value stored at that memory location, but also of consecutive memory locations starting at that location.
The full syntax for the command is x /nfu <addr> where n specifies how many consecutive memory locations to print; f is the format of the data as explained for the print command, and u is the size of each memory location. So x /5dw arr will print 5 decimal (d) words (32bits) starting at the pointer arr.
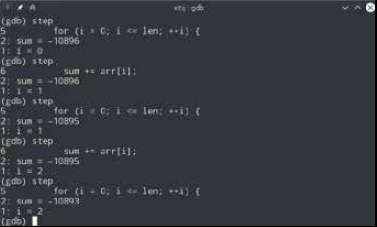
Finally let’s look at the display command. Chances are you want to continuously look at the value of a particular variable or memory location after each step. Rather then using the print or x commands again and again, you can use thedisplay /format <var/ address> command. It will automatically display data using the print or x command based on your parameters each time you step forward in your code.
Conclusion
The GNU debugger is a phenomenally powerful tool, even with the basic introductory knowledge that you have gained from this article. There is of course a whole lot more that you can do with gdb.
GDB Shortcuts
Most gdb commands can be abbreviated to just one or two letters. Here are a few you might find useful:
• run – r
• step – s
• stepi – si
• next – n
• nexti – ni
• print – p
• list – l
• continue – c
Often, you need to repeat the same command again and again. For instance, you might want to step through code a couple of times. Rather than type “step” repeatedly, or even type “s” repeatedly, you can just press [Enter] to repeat the previous command.
With each step here gdb is displaying both, the value of i the loop counter and sum
For instance, gdb can also be used to debug a program that is already running, and in fact it can even connect to a remote computer and debug programs running on it. It also supports reverse debugging. It can even record and playback the execution of applications and a whole lot more. We’ve only scratched the surface here but hopefully we have provided you with a good launching pad.

