If you write enough code, sooner or later you’ll run into a situation where just putting in print statements to figure out if there are errors won’t be enough. You’ll need a specialised tool to debug your code. If you’re using the free GNU Compiler Collection (GCC), then there’s no better tool than ‘gdb’, also known as the ‘GNU Debugger’. If you use Linux, chances are it’s already installed and set up. But it isn’t limited only to Linux and Unices. In fact, since it’s open source and runs in the command line, it’s been ported to all kinds of hardware platforms and operating systems.
If you’re wondering why you should use a command line tool in this day and age, well, firstly, that’s because it has an extensive feature set, combined with a price point of zero that’s hard to match. There are GUI frontends and IDE integrations available for gdb, however, they don’t include all of its features. That said, if you just need basic debugging, such tools might work well for you.
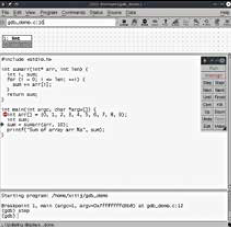
ddd is a popular GUI frontend for gdb, although at this point the interface is quite dated.
Since the GNU Debugger is the most widely available and supported version, it’s the command line that we’ll look at in this article. So let’s begin!
The basic gdb workflow
Before we move on to more complex stuff, let’s first get the basic usage of gdb out of the way. To effectively use gdb, you must compile the source code with debug information included. This isn’t strictly necessary, and you can even debug commercial applications for which you don’t have the source code. We can now launch gdb and provide the location to your application. For instance, you can run gdb myapp or gdb /home/user/code/myapp. This won’t immediately run your application in the debugger. Before doing that, you may want to do things such as setup breakpoints.
Once breakpoints are set up, we can issue the run command to gdb to run the application code inside the debugger. This runs the code up until the first breakpoint is encountered. At this point, we can step through the code while examining how the value of different variables change. We can step through the code source one line at a time, or even at the assembly level, one instruction at a time. We can inspect the contents of the memory and even low level registers. And then even modify memory locations, if needed. Let’s look at how to do most of these things.
Example code
Before we start the debugging code, let’s take a look at the sample buggy code we’ll be using. The bugs in this code may be obvious, but remember that probably wont be the case when you’re using a debugger.
#include <stdio.h>
int sumarr(int* arr, int len) {
int i, sum;
for (i = 0; i <= len; ++i) {
sum += arr[i];
}
return sum;
}
int main(int argc, char *argv[]) {
int arr[] = {0, 1, 2, 3, 4, 5, 6, 7, 8, 9};
int *sum;
*sum = sumarr(arr, 10);
printf(“Sum of array arr %s”, sum);
}
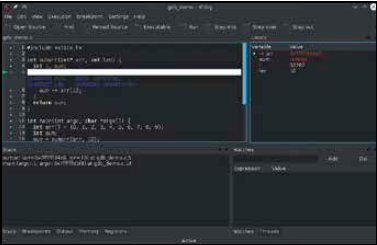
Kdbg is a GUI frontend for gdb developed by KDE. It is quite powerful and includes most of the features you’d need for debugging
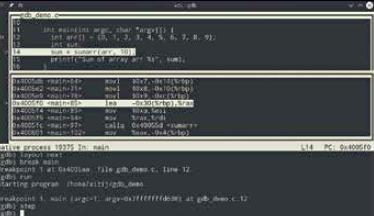
gdb includes a curses-based UI that might be more comfortable for some. You launch gdb in this mode with gdb -tui
Running and viewing code
Once you’ve started gdb and provided it the path to your application, you can run the application by simply typing “run”. This will run the program as normal, producing output, asking for input etc. You can also provide command line arguments (if any) to the run command.
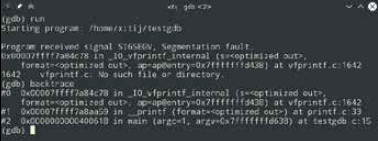
If the program crashes while running under gdb, you‘ll notice that you get a lot more information than you would if you were running it directly. For example, it will tell you where exactly in your program (or out of it) the crash occurred, and will even display the code for that line.
If you want even more information, you can type the “backtrace” command to get the exact chain of function calls that led to the crash.
At this point if you want you can type list to list the code around this area. You can even provide list a line number and it will print the code around that line.
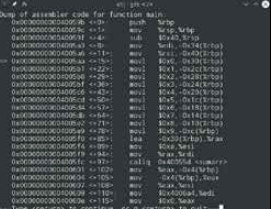
It can sometimes also be useful to see the assembly code generated from your source code, if the problem isn’t visible at a high level. To view the assembly code for your program type disas.
With disas /m you can see your own code interleaved with the assembly code generated from it. It’s also a brilliant way to get familiar with assembly.
Chances are you want to pause running your application before it reaches the point that leads to a crash so you can diagnose the state of the application there. For that you need to set breakpoints, we look at those next.
Setting breakpoints
A breakpoint is place within your code where gdb will halt the automatic execution of code and turn over control to you. There are a number of ways that you can set breakpoints. The simplest way to set a breakpoint is to specify a line number at which the code should stop executing. You can use the list command explained above to figure out what the line numbers are.
Another way to set a breakpoint is to set it using the name of the function. In this case execution halts if that function is called. Withbreak main you can halt execution when your program starts executing its main function.
A more interesting way to set a breakpoint, is to have a conditional break based on the state of the program. For instance you might want to halt the code if a particular variable reaches a certain value. You can specify such a break as follows:
break if i > 5
If an application keeps crashing on launch sometimes running it under gdb can give you a hint as to why.
With a good understanding of assembly, you can find bugs without even having access to the source code
This can make it much easier to handle loops, allowing you to break only after a certain number of iterations. You can also look out of cases where a variable is going out of its range. Another related concept is that of watchpoints. With watchpoints you can have the execution of a program halt when a particular variable or memory location is modified, without worrying about what the exact value is. The way to set a watchpoint is to use watch keyword followed by the name of the variable to watch. For examples: watch ctr to pause when the variable ctr is modified.

